
Instructions
Introduction
Test Setup
Taking Images
Using the Program
Interpreting Results
|
|
Instructions
Introduction |
These instructions assume that you understand the basics of knife-edge testing. If not, there is extensive literature, both on-line and off, that explains the theory and the procedure of the test in great detail. Just about every book related to amateur telescope making, such as Texereau, Berry or Willman-Bell's collection, has a chapter dedicated to the test.
Online, try a Google search or
one of these excellent resources:
If you'd like to learn more about the mathematics used to interpret the results of a Foucault test, Jim Burrows has an excellent overview available at
This program analyzes images from a moving-source Foucault test. This means that the light source (pin-hole, slit or another section of the same knife edge) moves together with the knife. The most popular type of moving-source tester nowadays seems to be the slitless tester. The simplest way to make one is to attach a large and bright LED to one side of a utility-knife blade, so that only one half of the LED illuminates the mirror. The camera is then placed near another section of the blade on the same side as the LED, so the reflection of the LED can be "cut off" by tilting the blade. It is essential that the two sections of the blade be parallel to each other, since they need to effectively form a slit as far as photons are concerned; in other words, the knife edge must be straight. The widely available and inexpensive multi-segmented utility knives tend to be quite satisfactory in this regard.
The medhod employed to analyze test images is a slight variation of the common Couder mask method. When the knife is inside the mirror's radius of curvature and touching the axis of the mirror, the image of the knife will appear to shade one half of the mirror's surface. On the outside of the radius of curvature the image will flip upside-down, so the knife will shade the other half. The distance where this flip happens tells us the radius of curvature of the mirror. When using a Couder mask, one divides the mirror radially into zones, and then finds the average radius of curvature of each zone by finding the exact knife position where the rate of darkening of the zone on the opposide sides of the mirror is equal. In contrast, this program uses "zones" one pixel wide, quantifies the illumination of the two mirror halves at many different knife positions, and then extrapolates the knife position where the illuminations get equal.
Because the method analyzes data from many images at once, accurate measurement of knife position for any one image is not critical. In fact, I was able to achieve good enough accuracy by sticking the LED/knife assembly into a block of wood, with the knife oriented horizontally, and moving the assembly by nudging it along a ruler attached to a flat surface. Eyeballing the relative position of the knife on the ruler is quite sufficient--no micrometers required! If you use this method, you'll need a way to elevate and tilt the flat surface so that the knife edge slides along the mirror's axis. The simplest way of achieving this is to run three screws through a piece of smooth plywood or plastic kitchen cutting board. Of course, this crude method is unsuitable for very large or very thin mirrors, since the mirror will sag under its own weight enough to significantly skew test results.
The number of knife offsets and images required to make a good measurement will vary with your mirror's focal ratio. A good starting point is to begin about a centimeter inside the average radius of curvature and take twenty or so images one millimeter apart. If you are using a tester with a slit or a pin-hole, the shadow flip will occur over a smaller distance so you can reduce knife travel accordingly.
To get meaningful results from image analysis, you need to take some precautions to ensure a good quality of images without large systematic effects. Here are some tips to ensure an accurate measurement:
Image format doesn't seem to make any practical difference. Lossy formats such as JPEG tend to lose information in an unbiased manner, so given a choice by your camera use any format that lets you store enough images to complete an entire sequence without having to download and erase images in the middle of a measurement. The program currently supports JPEG, PNG and GIF formats.
As a guideline, this is what a good sequence of images looks like:
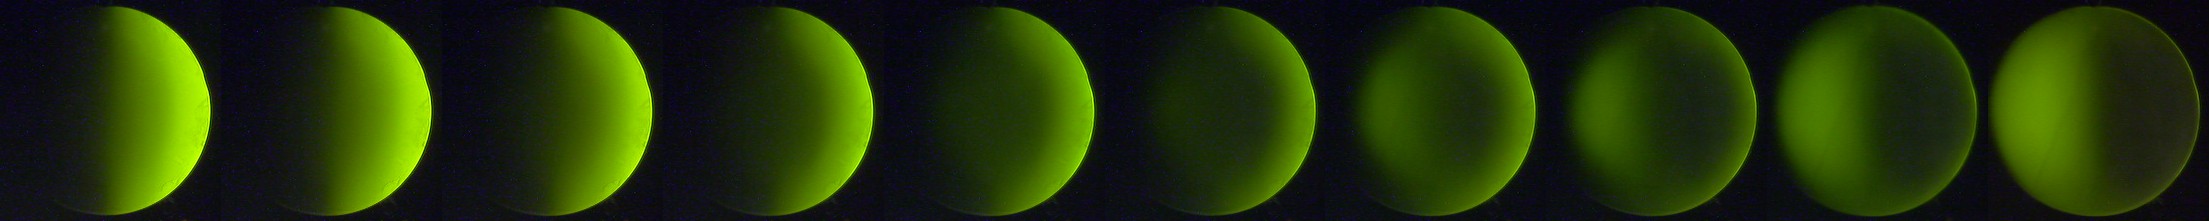
If your camera can achieve this kind of contrast, uniformity and resolution, you're all set.
Now that you're armed with a good set of images of your mirror, it's time
to fire up the mighty analysis engine.
By this point you should have successfully
downloaded
and
installed the
software. Before proceeding any further, you should select a place
on a hard drive with lots of free space where you'll keep all the images
and the project file. For the sake of this discussion, let's say this location
is c:\mymirror.
You will probably be making quite a few measurements as the figuring
progresses. To avoid confusion, it's a good idea to keep
the images of each measurement in a separate directory. Therefore,
create a directory c:\mymirror\measurement-1 and download
into it the images of the first measurement from your camera.
When you first start the software, you will be greeted by the
project pane.
Before doing anything
else, fill in the title, description and parameters of your mirror, then
select Save As from the File menu and save your project to
a file such as c:\mymirror\mirror.xml. It's a good idea
to keep the project file one directory level above the image files;
that will save you some time when entering new measurements in the future,
and makes it easy to back up the entire project. Once you save your
project, the program will remember its location and open it automatically
the next time you invoke it.
All the functionality of the program is accessed through four panes.
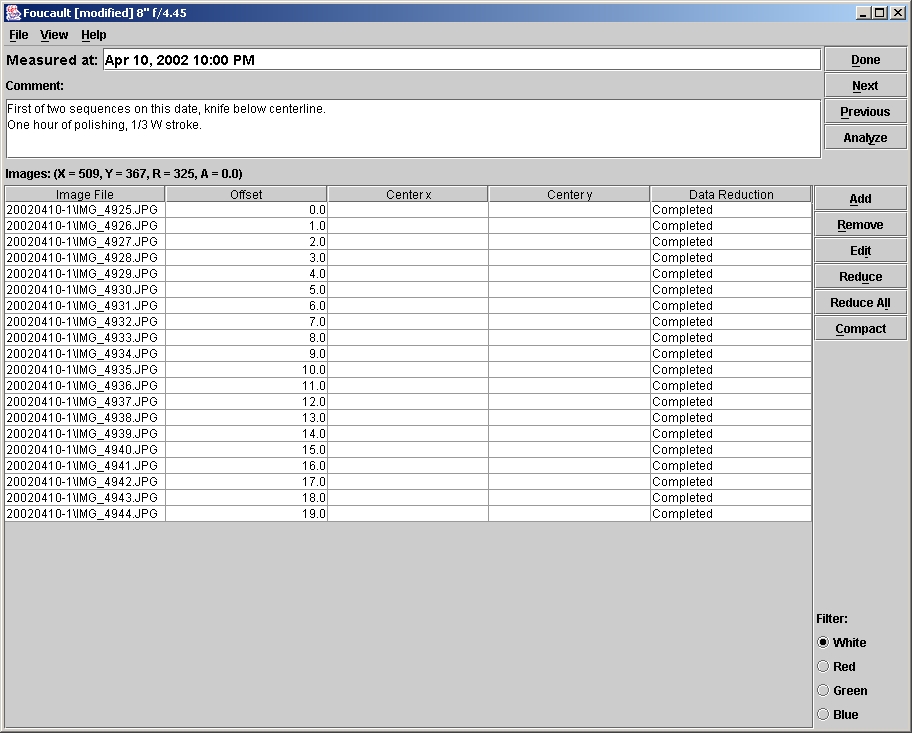
Images are on the disk, project file is saved, let's analyze.
c:\mymirror directory. Navigate to
c:\mymirror\measurement-1, select all the images and
click Open. The list of images will fill up with files sorted
alphabetically and each image will be assigned a default offset
starting from zero and incrementing by one millimeter.
You can apply a color "filter" to each measurement to increase image contrast--see the radiobuttons at bottom right of the measurement pane. What this actually means is that during data reduction only a single color of each pixel will be taken into account. How pixel colors map to the physical wavelength(s) of light used depends on the camera and the light source. For example, a green LED that I use excites green and red pixels in Canon G1 about equally, blue pixels hardly at all.
You have a choice between saving a little bit of space and a little bit of time. Any reduced data present when you save a project gets saved in the project file. For large images and a large number of measurements this can result in a very large project file. If you have a fast computer so you'd rather re-run the reduction every time you wish to repeat the analysis, click Compact on the measurement pane to discard any reduced data for that measurement before saving.
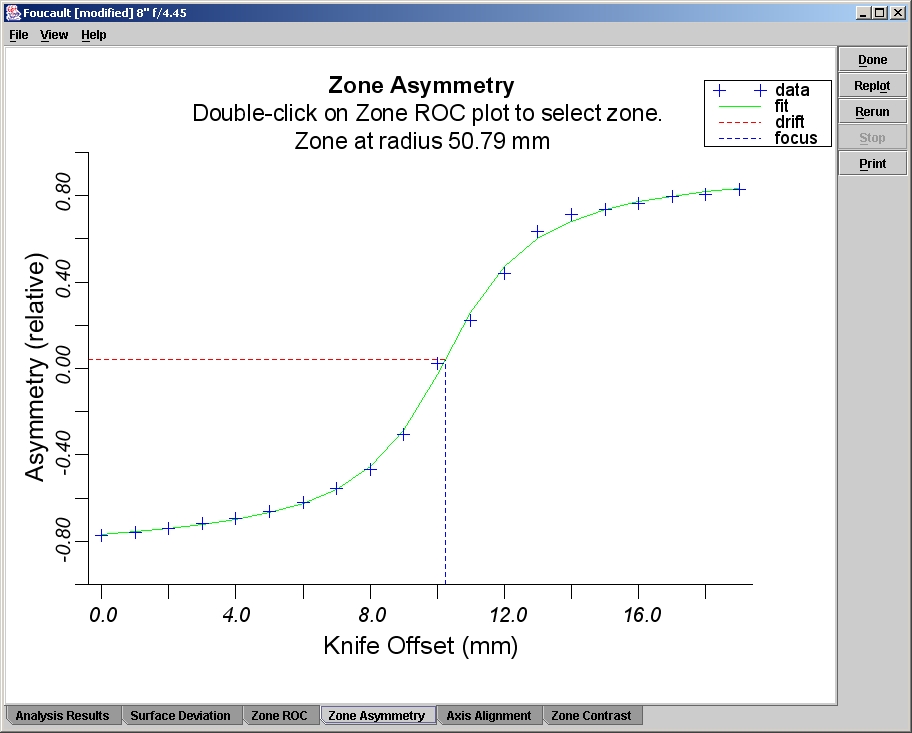
As you begin taking and analyzing measurements, spend some time adjusting your test apparatus so the knife travels along the mirror's axis. In other words, look at the Axis Alignment graph and get the data line as close to zero as possible by finely adjusting the orientation of you tester. Misalignment will produce inaccurate readings that get worse toward the mirror's center. [Note: there is probably a way to compensate for this from the available data on a purely geometric basis. If you have some spare time and a little programming skill, this improvement would make a nice high-school-level project.]
Another piece of information that you want to watch early on is the effective image contrast. Adjust the settings of your camera to maximize it, but do not saturate too many pixels since that will reduce the dynamic range at the other end.
As you get proficient in taking photos of the test, you will likely need to watch only the numeric results and the surface deviation plot; all the other graphs are shown only to let you fine-tune your test setup and as a sanity check.
The surface deviation measurement tells you what to do with the mirror to bring it closer to ideal. Any regions above the zero line need to have material taken off by polishing; the ones below zero should be polished less. The exact actions required to correct specific defects depend on too many factors to even start explaining here. The books mentioned near the top of this page will give you many ideas, but keep in mind that there is no single correct answer: any method that takes glass off in the right places will ultimately work. Also, your particular polishing tool will have its own "character." It is a very good idea to describe well every measurement, so that later on you will be able to find and reapply a method that in the past produced a certain desirable result with the same tool.
Finally, the numeric results of an analysis tell you when to stop working on the mirror. There are three quantitative measures of mirror quality:
And when you reach that perfect mirror, please do send me an email describing your impressions about the program and suggestions for improvement. Remember, this code is free software, meaning not only free as in money, but also free as in you're free to study it and improve it yourself!
Maintained by Dejan Vucinic <dvucinic (at) users.sourceforge.net>
Last updated on May 28th, 2002.
Back to index